Ethereum has shown signs of life after a sharp dip that pushed the asset toward the $1,500 mark. The bounce has lifted short‑term optimism, yet the structural picture on higher timeframes remains tilted to the downside. With ETH still trading beneath both the 100‑day and 200‑day moving averages—and confined by a long‑term descending trendline—the market is at a crossroads. The next few trading sessions will likely decide whether this upward move can evolve into a sustained recovery or merely a relief rally within a broader bearish phase.
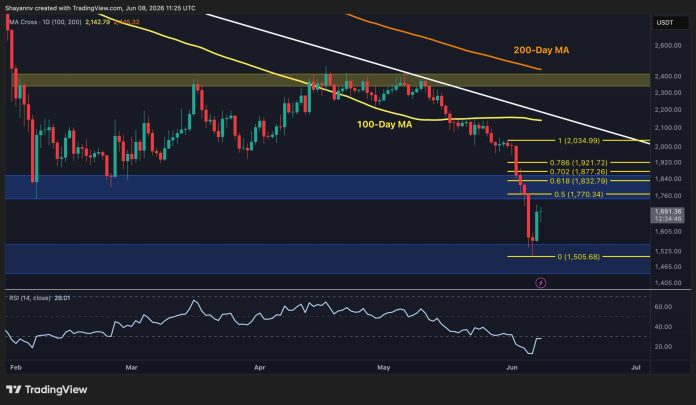
On the daily chart, the price briefly violated the $1,500 demand zone before buyers stepped in, nudging ETH toward the $1,700 region. Despite this rebound, the asset remains below the 100‑day MA (~$2,100) and the 200‑day MA (~$2,400), a clear indication that the medium‑term trend is still bearish. The descending trendline that has capped rallies since the 2022 highs continues to act as a ceiling, reinforcing seller dominance. Moreover, the recent sell‑off created a bearish impulse that now frames potential retracement levels where sellers may re‑engage.
Fibonacci analysis of the latest leg down highlights three key resistance clusters: the 0.5 retracement near $1,770, the 0.618 level at roughly $1,830, and the 0.786 retracement around $1,920. These zones are likely to serve as initial supply areas if the broader downtrend persists. Traders should watch for price action around these levels; a decisive break above $1,920 would be required to invalidate the current bearish structure and open the path toward the $2,000‑$2,200 range.
Shifting to the 4‑hour timeframe offers a more nuanced view. After the capitulation low near $1,500, ETH formed a strong reactionary bounce and is presently finding support from a bullish fair value gap (FVG) situated around $1,640. This FVG acts as an immediate demand zone and could cushion any short‑term pullback. The recovery has also pushed the Relative Strength Index (RSI) above its midpoint, signalling improving momentum following the aggressive sell‑off.
Nevertheless, the price remains beneath the critical Fibonacci resistance band between $1,750 and $1,850—a region that now represents the primary liquidity pool where sellers may attempt to reassert control. As long as ETH holds above the $1,640 FVG, a move toward the $1,770‑$1,830‑$1,920 resistance cluster remains plausible. A sustained reclaim of $1,770 could trigger a short‑squeeze, propelling the asset toward $1,830 and then $1,920. Conversely, a breach below the $1,640 FVG would undermine the recovery framework, increasing the likelihood of a retest of the $1,500 low and potentially extending the downtrend.
Sentiment indicators add another layer of insight. The Coinbase Premium Index, which measures the spread between Coinbase’s ETH/USD price and the broader market, has begun to tick upward, suggesting that spot buying pressure on the U.S. exchange is strengthening. While not a definitive bullish signal, a rising premium often coincides with increased institutional interest and can precede broader market rallies.
In summary, Ethereum’s current recovery is at a pivotal juncture. The asset must clear the $1,770‑$1,850 resistance zone and maintain support above the $1,640 fair value gap to shift the bias toward a more constructive outlook. Failure to do so would likely see sellers regain control, prompting another test of the $1,500 low and reinforcing the prevailing bearish narrative. Market participants should monitor volume, RSI behavior, and the Coinbase Premium for confirmation of any sustained upward momentum.