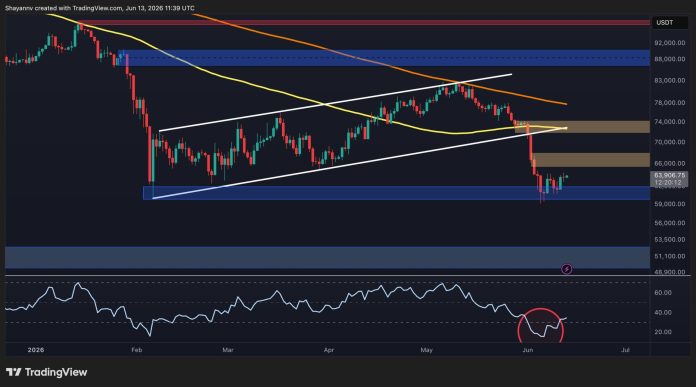
Bitcoin’s recent pullback has once again underscored the delicate balance between bullish momentum and bearish supply. After breaking through a long‑term rising channel and snapping the $70,000 psychological barrier, the cryptocurrency slipped roughly ten thousand dollars in a matter of days, settling into the critical $60,000 support area.
Although the daily chart now shows a modest rebound, the broader technical picture remains overwhelmingly bearish. Bitcoin continues to trade below both the 100‑day and 200‑day moving averages, which are converging above the $70,000 level and act as dynamic resistance. The asset must first reclaim the $65,000–$68,000 zone, a crucial overhead resistance area that houses significant seller concentration. Failure to break above this range could trigger a retreat back to the $60,000 support, and a collapse from there would likely push the price toward the next major cluster near $51,000.
The 4‑hour chart offers a slightly more optimistic short‑term outlook. Following the steep sell‑off, Bitcoin forged an ascending channel around the $60,000 mark, and the Relative Strength Index has moved out of deep oversold territory. However, the channel’s upper boundary sits squarely within the $65,000–$68,000 range, meaning any significant rally will face stiff resistance. A decisive move above $68,000 could unleash a new wave of buying that targets the $72,000–$74,000 supply zone, a level that historically coincides with the former channel support and a likely catalyst for a higher‑time‑frame trend change.
On‑chain data reinforces the cautionary tone. The distribution of unspent transaction outputs (UTXOs) shows a concentration of coins in the profitable range above $60,000, suggesting that many holders are still positioned to sell if the price dips. Meanwhile, network activity has remained relatively flat, indicating limited institutional inflows that could otherwise shore up the recovery. The lack of significant on‑chain buying pressure means that any upward movement would need to be sustained by a sharp increase in demand.
From a risk‑management perspective, traders should treat the $60,000 level as a dynamic support rather than a firm floor. A breach could trigger a cascade of stop‑loss orders and ignite a sharper decline toward the $51,000 threshold, where market depth historically increases. Conversely, a successful breakout above $68,000 would provide a clear signal that the bearish structure is breaking, opening the door to a medium‑term rally.
In summary, Bitcoin’s current trajectory hinges on its ability to navigate the $65,000–$68,000 resistance zone. While short‑term charts hint at a recovering bias, the overarching technical and on‑chain fundamentals suggest that a full reversal remains elusive. Market participants should monitor both price action and on‑chain sentiment closely, as the next few weeks will be critical in determining whether Bitcoin can break the $70,000 ceiling or retreat back toward lower support levels.